Table of contents
Introduction
Cyclistic is a bike-share program based in Chicago with a fleet of 5,824 bicycles that are geotracked and locked into a network of 692 stations across Chicago. Until now, Cyclistic’s marketing strategy relied on building general awareness and appealing to broad consumer segments. One approach that helped make these things possible was the flexibility of its pricing plans: single-ride passes, full-day passes, and annual memberships. Customers who purchase single-ride or full-day passes are referred to as casual riders. Customers who purchase annual memberships are Cyclistic members. Cyclistic’s finance analysts have concluded that annual members are much more profitable than casual riders.
Although the pricing flexibility helps Cyclistic attract more customers, Moreno believes that maximizing the number of annual members will be key to future growth. Rather than creating a marketing campaign that targets all-new customers, Moreno believes there is a very good chance to convert casual riders into members. She notes that casual riders are already aware of the Cyclistic program and have chosen Cyclistic for their mobility needs.
Moreno has set a clear goal: Design marketing strategies aimed at converting casual riders into annual members. In order to do that, however, the marketing analyst team needs to better understand how annual members and casual riders differ, why casual riders would buy a membership, and how digital media could affect their marketing tactics. Moreno and her team are interested in analyzing the Cyclistic historical bike trip data to identify trends.
The analysis will include a detailed breakdown of the 6 phases of the Data Analysis process: Ask, Prepare, Process, Analyze, Share and Act.
Ask:
Questions guiding the analysis:
How do annual members and casual riders use Cyclistic bikes differently?
Key Stakeholders include:
Lily Moreno: The director of marketing and my manager.
Cyclistic Marketing Analytics Team: A team of data analysts who are responsible for collecting, analyzing, and reporting data that helps guide Cyclistic marketing strategy.
Cyclistic Executive Team: The notoriously detail-oriented executive team will decide whether to approve the recommended marketing program.
Prepare:
Data and its Location: I was tasked to work with 12 months of data from January 2022 to December 2022 located on this link
Data licensing & privacy: The data was been made available by Motivate International Inc.
Process:
I decided to use SQL (BigQuery) for cleaning and querying the data, and Tableau for Visualization due to the size of the data to be analysed.
After confirming that all my data had the same schema and number of columns,in order to prove consistency, I then combined each of my monthly dataset into a single, annual dataset by performing the FULL OUTER JOIN FUNCTION on the individual columns.
SELECT *,
FROM active-incline-393913.2022.January
FULL OUTER JOIN active-incline-393913.2022.February USING (ride_id,
started_at,
ended_at,
start_station_name,
start_station_id,
end_station_name,
end_station_id,
start_lat,
start_lng,
end_lat,
end_lng,
member_casual,
rideable_type)
UNION DISTINCT
SELECT *
FROM active-incline-393913.2022.January
FULL OUTER JOIN active-incline-393913.2022.March USING (ride_id,
started_at,
ended_at,
start_station_name,
start_station_id,
end_station_name,
end_station_id,
start_lat,
start_lng,
end_lat,
end_lng,
member_casual,
rideable_type)
UNION DISTINCT
SELECT *
FROM active-incline-393913.2022.January
FULL OUTER JOIN active-incline-393913.2022.April USING (ride_id,
started_at,
ended_at,
start_station_name,
start_station_id,
end_station_name,
end_station_id,
start_lat,
start_lng,
end_lat,
end_lng,
member_casual,
rideable_type)
UNION DISTINCT
SELECT *
FROM active-incline-393913.2022.January
FULL OUTER JOIN active-incline-393913.2022.May USING (ride_id,
started_at,
ended_at,
start_station_name,
start_station_id,
end_station_name,
end_station_id,
start_lat,
start_lng,
end_lat,
end_lng,
member_casual,
rideable_type)
UNION DISTINCT
SELECT *
FROM active-incline-393913.2022.January
FULL OUTER JOIN active-incline-393913.2022.June USING (ride_id,
started_at,
ended_at,
start_station_name,
start_station_id,
end_station_name,
end_station_id,
start_lat,
start_lng,
end_lat,
end_lng,
member_casual,
rideable_type)
UNION DISTINCT
SELECT *
FROM active-incline-393913.2022.January
FULL OUTER JOIN active-incline-393913.2022.July USING (ride_id,
started_at,
ended_at,
start_station_name,
start_station_id,
end_station_name,
end_station_id,
start_lat,
start_lng,
end_lat,
end_lng,
member_casual,
rideable_type)
UNION DISTINCT
SELECT *
FROM active-incline-393913.2022.January
FULL OUTER JOIN active-incline-393913.2022.August USING (ride_id,
started_at,
ended_at,
start_station_name,
start_station_id,
end_station_name,
end_station_id,
start_lat,
start_lng,
end_lat,
end_lng,
member_casual,
rideable_type)
UNION DISTINCT
SELECT *
FROM active-incline-393913.2022.January
FULL OUTER JOIN active-incline-393913.2022.September USING (ride_id,
started_at,
ended_at,
start_station_name,
start_station_id,
end_station_name,
end_station_id,
start_lat,
start_lng,
end_lat,
end_lng,
member_casual,
rideable_type)
UNION DISTINCT
SELECT *
FROM active-incline-393913.2022.January
FULL OUTER JOIN active-incline-393913.2022.October USING (ride_id,
started_at,
ended_at,
start_station_name,
start_station_id,
end_station_name,
end_station_id,
start_lat,
start_lng,
end_lat,
end_lng,
member_casual,
rideable_type)
UNION DISTINCT
SELECT *
FROM active-incline-393913.2022.January
FULL OUTER JOIN active-incline-393913.2022.November USING (ride_id,
started_at,
ended_at,
start_station_name,
start_station_id,
end_station_name,
end_station_id,
start_lat,
start_lng,
end_lat,
end_lng,
member_casual,
rideable_type)
UNION DISTINCT
SELECT *
FROM active-incline-393913.2022.January
FULL OUTER JOIN active-incline-393913.2022.December USING (ride_id,
started_at,
ended_at,
start_station_name,
start_station_id,
end_station_name,
end_station_id,
start_lat,
start_lng,
end_lat,
end_lng,
member_casual,
rideable_type)
Next, I decided to find the average ride length for each ride by substracting the “started_at” column from the “ended_at” column, but noticed an error in some observations where the ride “ended” before it even started. And so I highlighted those rows and deleted them from the database so as not to skew the analysis.
SELECT *
FROM active-incline-393913.2022.cyclist_trip_data
WHERE started_at>ended_at
--Average ride minutes for casual riders and annual members
SELECT
       casual AS MembershipType,
       AVG(ride_length) AS AverageTripDurationInMinutes
FROM
        active-incline-393913.2022.trip_data
WHERE
        membership_type = casual
UNION DISTINCT
SELECT
       member AS MembershipType,
       AVG(ride_length) AS AverageTripDurationInMinutes
FROM
       active-incline-393913.2022.trip_data
WHERE
       membership_type = member
Next, I checked if the primary key “ride_id” had any duplicates in order to remove them from the dataset.
--Checking if the primary key ride_id has duplicates
SELECT ride_id, count(ride_id) AS Count
FROM active-incline-393913.2022.cyclist_trip_data
GROUP BY ride_id
HAVING count(ride_id)>1
Then I retrieved the null count for each column of the dataset and deleted the ones likely to skew the analysis.
--getting null count for each columns
SELECT ride_id as ColumnName, COUNT(*) as NullCount
FROM active-incline-393913.2022.cyclist_trip_data
WHERE ride_id is null
UNION DISTINCT
SELECT rideable_type as ColumnName, COUNT(*) as NullCount
FROM active-incline-393913.2022.cyclist_trip_data
WHERE rideable_type is null
UNION DISTINCT
SELECT started_at as ColumnName, COUNT(*) as NullCount
FROM active-incline-393913.2022.cyclist_trip_data
WHERE started_at is null
UNION DISTINCT
SELECT ended_at as ColumnName, COUNT(*) as NullCount
FROM active-incline-393913.2022.cyclist_trip_data
WHERE ended_at is null
UNION DISTINCT
SELECT start_station_name as ColumnName, COUNT(*) as NullCount
FROM active-incline-393913.2022.cyclist_trip_data
WHERE start_station_name is null
UNION DISTINCT
SELECT start_station_id as ColumnName, COUNT(*) as NullCount
FROM active-incline-393913.2022.cyclist_trip_data
WHERE start_station_id is null
UNION DISTINCT
SELECT end_station_name as ColumnName, COUNT(*) as NullCount
FROM active-incline-393913.2022.cyclist_trip_data
WHERE end_station_name is null
UNION DISTINCT
SELECT end_station_id as ColumnName, COUNT(*) as NullCount
FROM active-incline-393913.2022.cyclist_trip_data
WHERE end_station_id is null
UNION DISTINCT
SELECT start_lat as ColumnName, COUNT(*) as NullCount
FROM active-incline-393913.2022.cyclist_trip_data
WHERE start_lat is null
UNION DISTINCT
SELECT start_lng as ColumnName, COUNT(*) as NullCount
FROM active-incline-393913.2022.cyclist_trip_data
WHERE start_lng is null
UNION DISTINCT
SELECT end_lat as ColumnName, COUNT(*) as NullCount
FROM active-incline-393913.2022.cyclist_trip_data
WHERE end_lat is null
UNION DISTINCT
SELECT end_lng as ColumnName, COUNT(*) as NullCount
FROM active-incline-393913.2022.cyclist_trip_data
WHERE end_lng is null
UNION DISTINCT
SELECT member_casual as ColumnName, COUNT(*) as NullCount
FROM active-incline-393913.2022.cyclist_trip_data
WHERE member_casual is null
Then I extracted the “Hour of Day” from the full timestamp in the “started_at” column.
SELECT
  *,
  FORMAT_TIMESTAMP('%I:%M %p', started_at) AS hour_of_day
FROM active-incline-393913.2022.cyclist_trip_data
Analyze & Share:
Here, I will analyze and visualize the dataset I cleaned by calculating the average ride duration for each member type.
--Average ride duration for casual riders and annual members
SELECT
 casual AS MembershipType, AVG(ride_length) AS AverageTripDurationInMinutes
FROM
 active-incline-393913.2022.cyclist_trip_data
WHERE
 membership_type = casual
UNION DISTINCT
SELECT
 member AS MembershipType, AVG(ride_length) AS AverageTripDurationInMinutes
FROM
 active-incline-393913.2022.cyclist_trip_data
WHERE
 membership_type = member

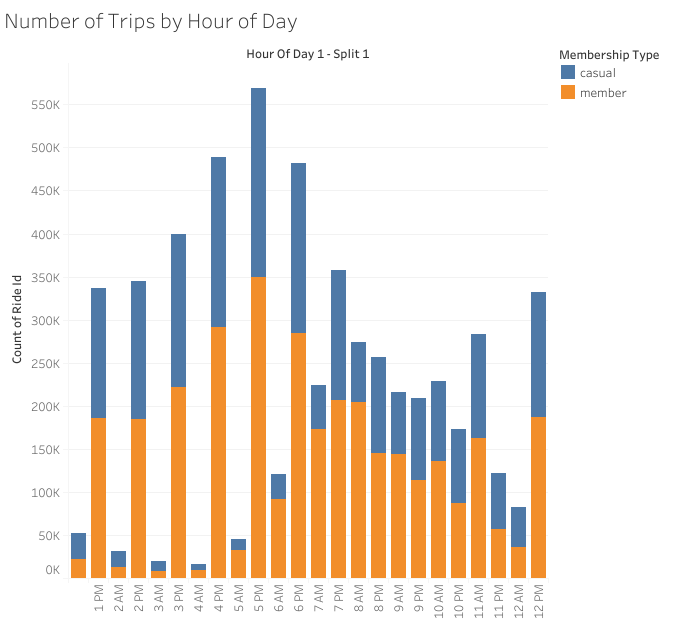
Next, I found the frequency of trips per hour of day between each membership type.
SELECT
  FORMAT_TIMESTAMP('%I %p', started_at) AS hour_of_day,
  COUNT(*) AS trip_count
FROM
active-incline-393913.2022.cyclist_trip_data
GROUP BY hour_of_day_1
ORDER BY hour_of_day_1;

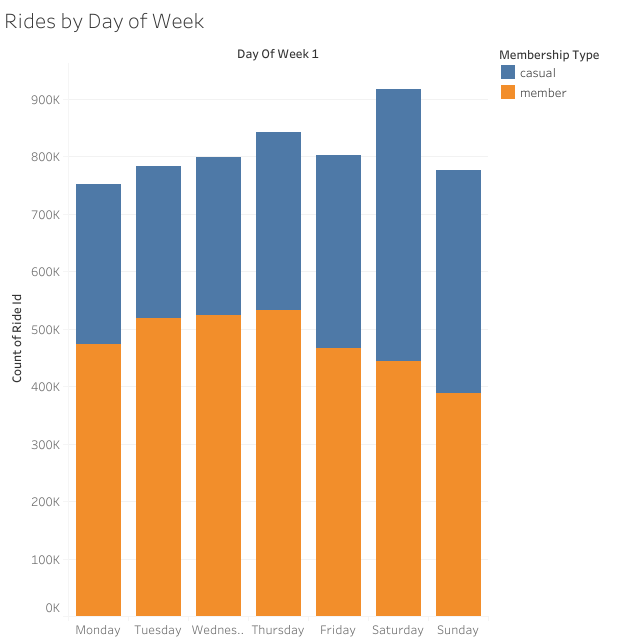
and then by day of week;
SELECT
  day_of_week_1,
  COUNT(*) AS ride_count
FROM
active-incline-393913.2022.cyclist_trip_data
GROUP BY day_of_week_1
ORDER BY day_of_week_1;

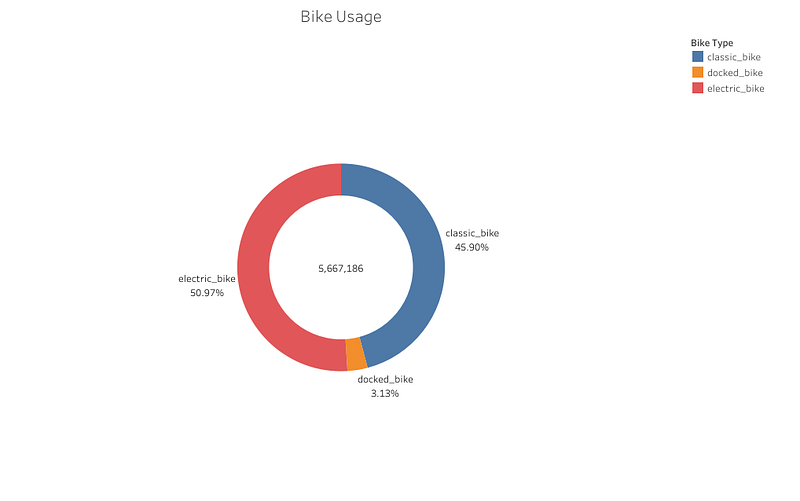
I also found the preferred bike type based on how often they used each bike type.
SELECT
  bike_type,
  membership_type,
  COUNT(*) AS ride_count
FROM
 active-incline-393913.2022.cyclist_trip_data
GROUP BY bike_type, membership_type
ORDER BY bike_type, membership_type;

And then I found the number of users in each membership type in order to understand the context and scale of the result of the analysis.
SELECT
 casual AS MembershipType, COUNT(ride_id) AS CountOfTrips,
FROM
 active-incline-393913.2022.cyclist_trip_data
WHERE
 membership_type = casual
UNION DISTINCT
SELECT
 member AS MembershipType, COUNT(ride_id) AS CountOfTrips
FROM
 active-incline-393913.2022.cyclist_trip_data
WHERE
 membership_type = member;
Please click here for a more detailed record of my Visualization, as well as a dashboard.
Act:
During the course of my analysis, the following insights were found:
There are more members than casual bike riders in terms of membership type.
Weekday rides are less common for casual cyclists. They tend to ride more on weekends, especially on Sundays.
When it comes to types of bikes, docked bicycles had the highest recorded numbers, preferred by both members and casual riders over classic and electric bikes.
During the week, casual riders had more than double the average ride duration compared to members.
The month of August saw the most rides, while January saw the fewest. The busiest months were June through October.
The above insights spurred the following recommendations:
Promotions for Weekday Rides: Since casual riders record fewer rides on weekdays, consider offering special promotions or discounts for weekday rides. This could include reduced membership fees or additional perks for rides taken during weekdays.
Trial Memberships: Offer a limited-time trial membership to casual riders, allowing them to experience the benefits of being a member without committing to a full year. This could include a discounted rate for the first month or a certain number of free rides.
Seasonal Promotions: Align promotions with the seasonal trends. For example, during the months where casual riders record higher ride durations, offer limited-time promotions or discounts for annual memberships to capture their increased interest.
Customizable Memberships: Introduce customizable membership plans that allow riders to choose plans based on their riding habits. For example, a plan that caters to weekend riders with special benefits for weekend usage.
The success of these marketing strategies should be tracked through data analytics and adapted based on ongoing insights and feedback from both casual riders and new members.
Thank you so much for reading. This is my first project, I would appreciate recommendations and tips for improvement.
